Monitoring staff productivity and the quality of care provided to patients or clients is essential. Access to detailed reports offers a significant advantage by providing a deep view of how these processes are carried out in your BrainHi portal.
These reports allow administrators to identify areas for improvement, optimize efficiency, ensure proper staff training, and raise the quality of care provided to patients or clients, contributing to the well-being and effective operation of your business.
Data provided by User Analytics
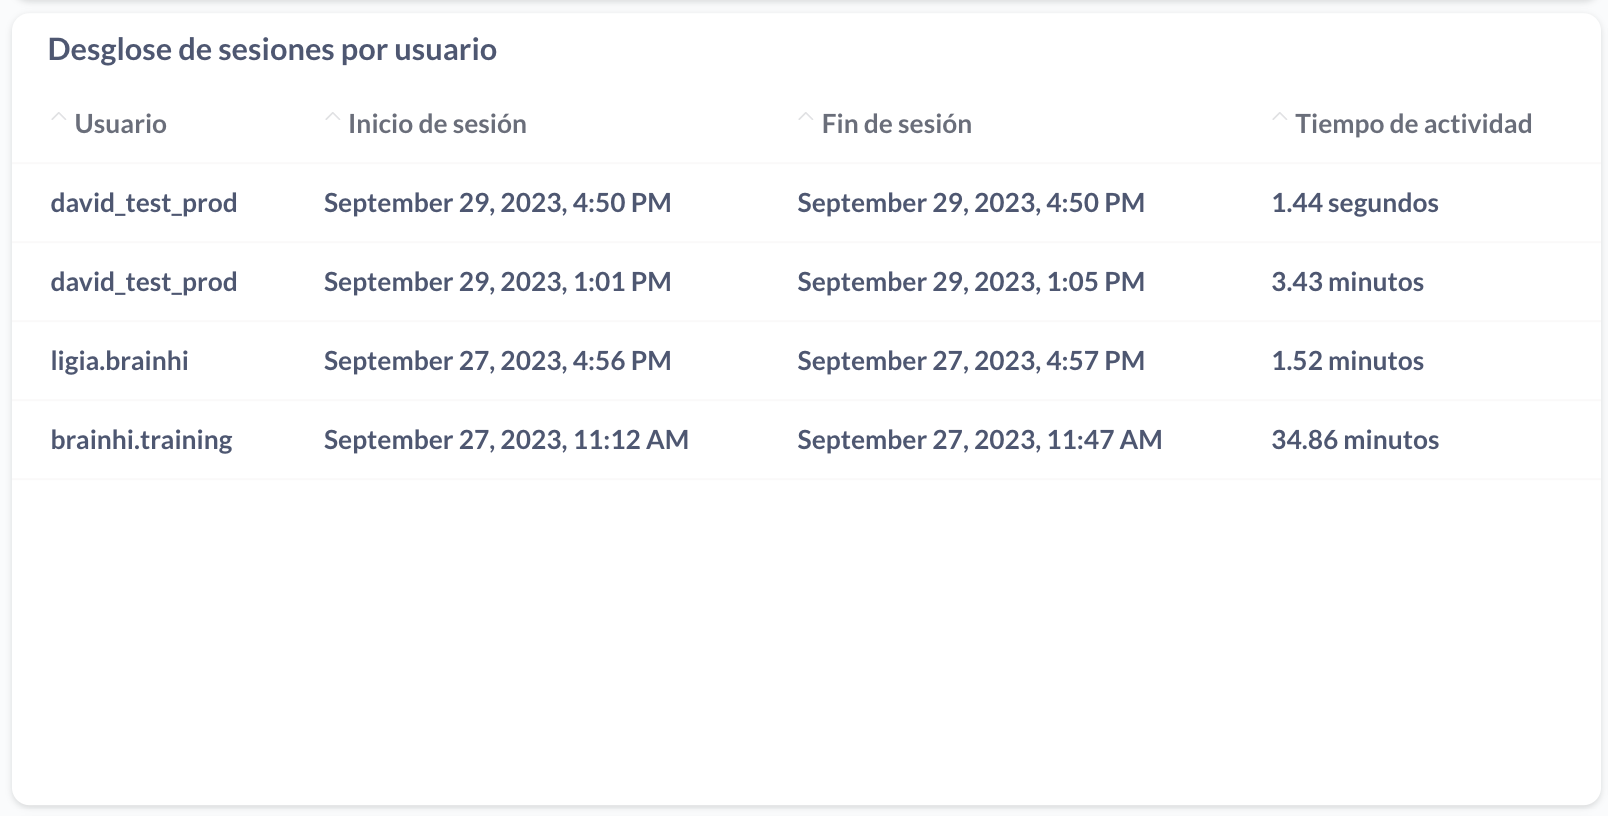
- Session breakdown by user: Shows the breakdown of all sessions recorded during the date period, displaying the start time (Login) and end time (Logout) of each session, and the total session time. Example:
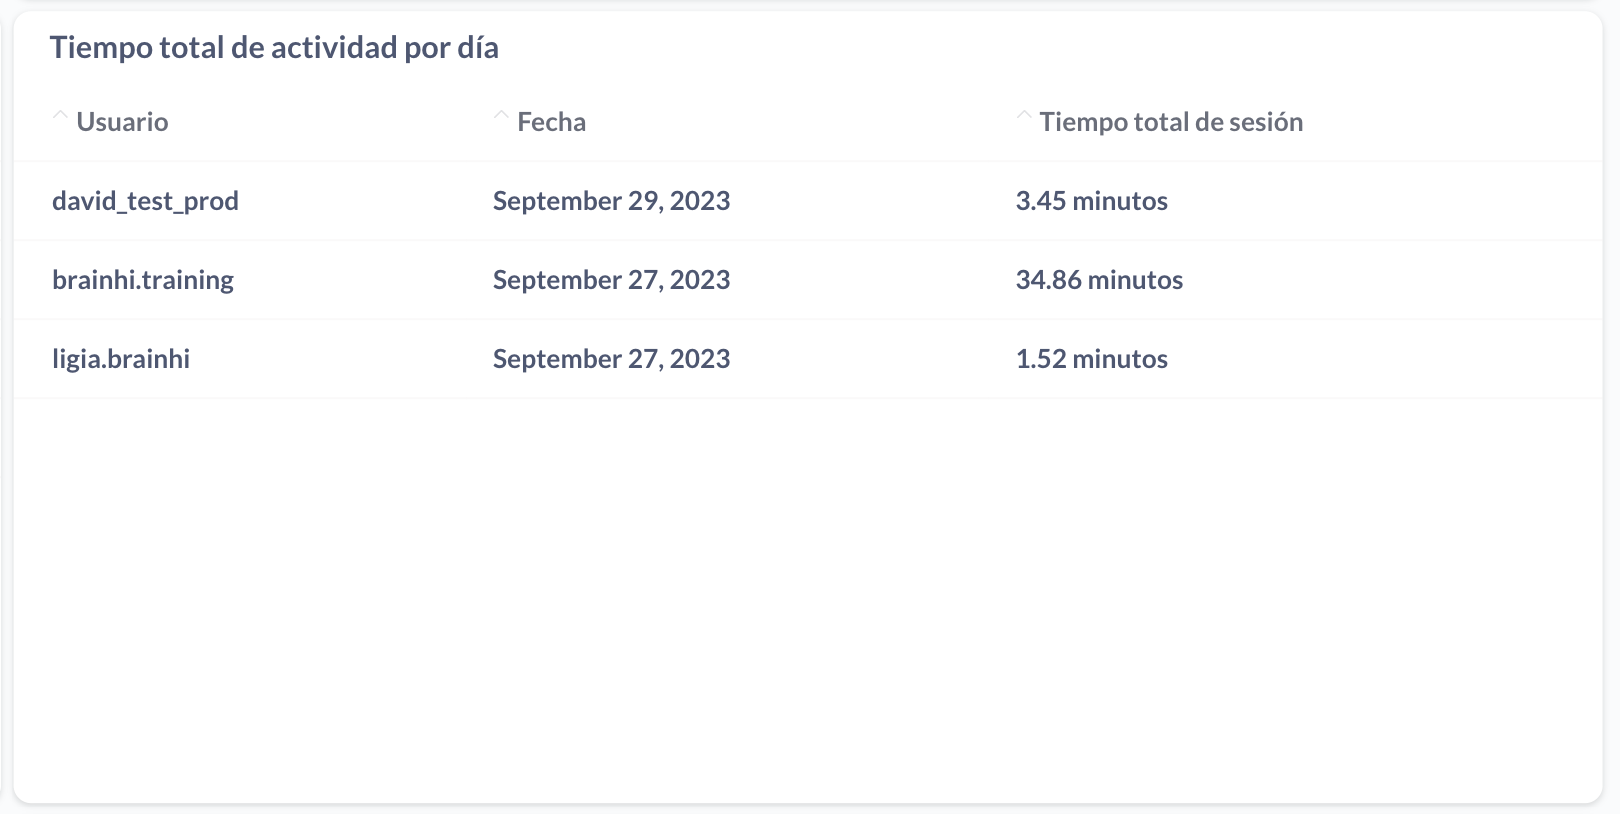
- Total activity time per day: Shows the sum of time across all sessions per user, grouped by day, displaying the total session time per day.
Example:
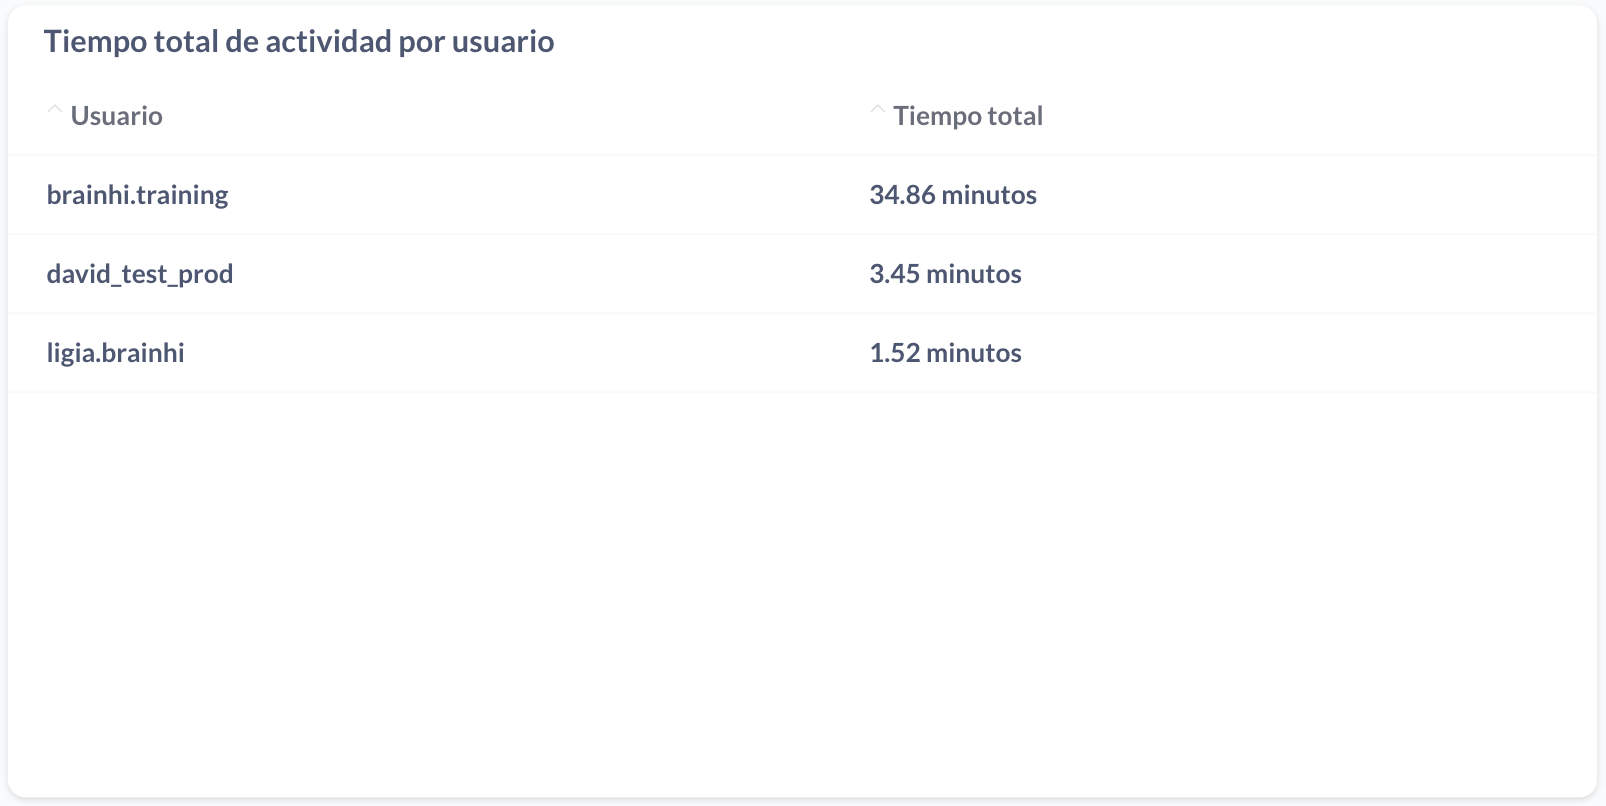
- Total activity time per user: Shows the sum of time across all sessions for each user.
Example:
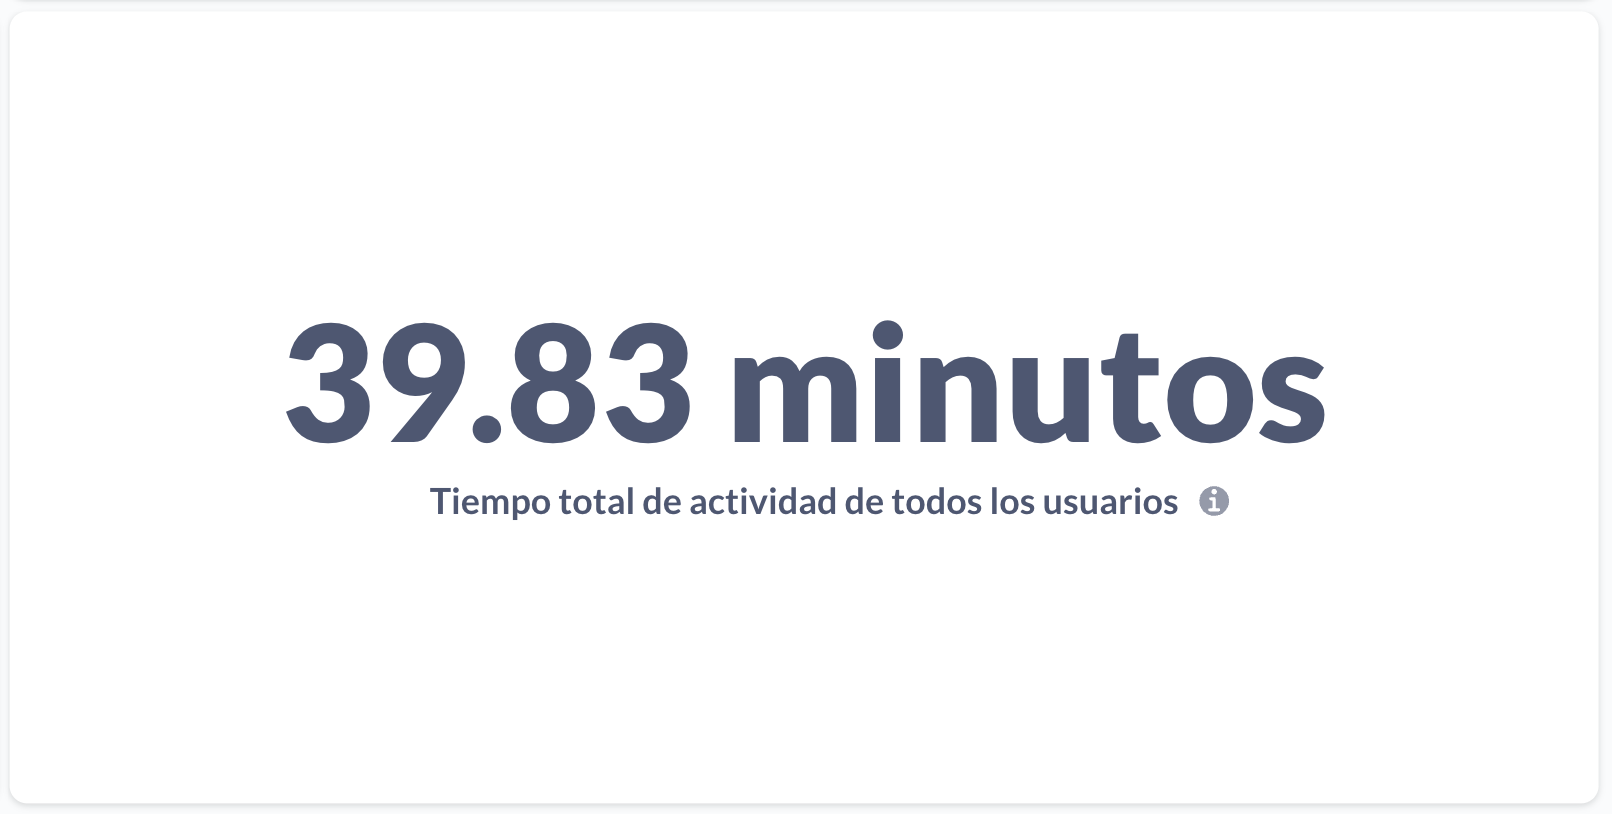
- Total activity time in BrainHi for all users: Shows the sum of time across all sessions of all users.
Example:
Related Articles